Digital Design
A chronological selection of websites and digital content designed by Horus.

Screenshot of a line chart tracking countries' gross domestic products and how they were impacted by the coronavirus pandemic.
An archive of data visualizations and interactive graphics used to enhance readers' engagement for data-driven stories written by Horus at U.S. News & World Report.

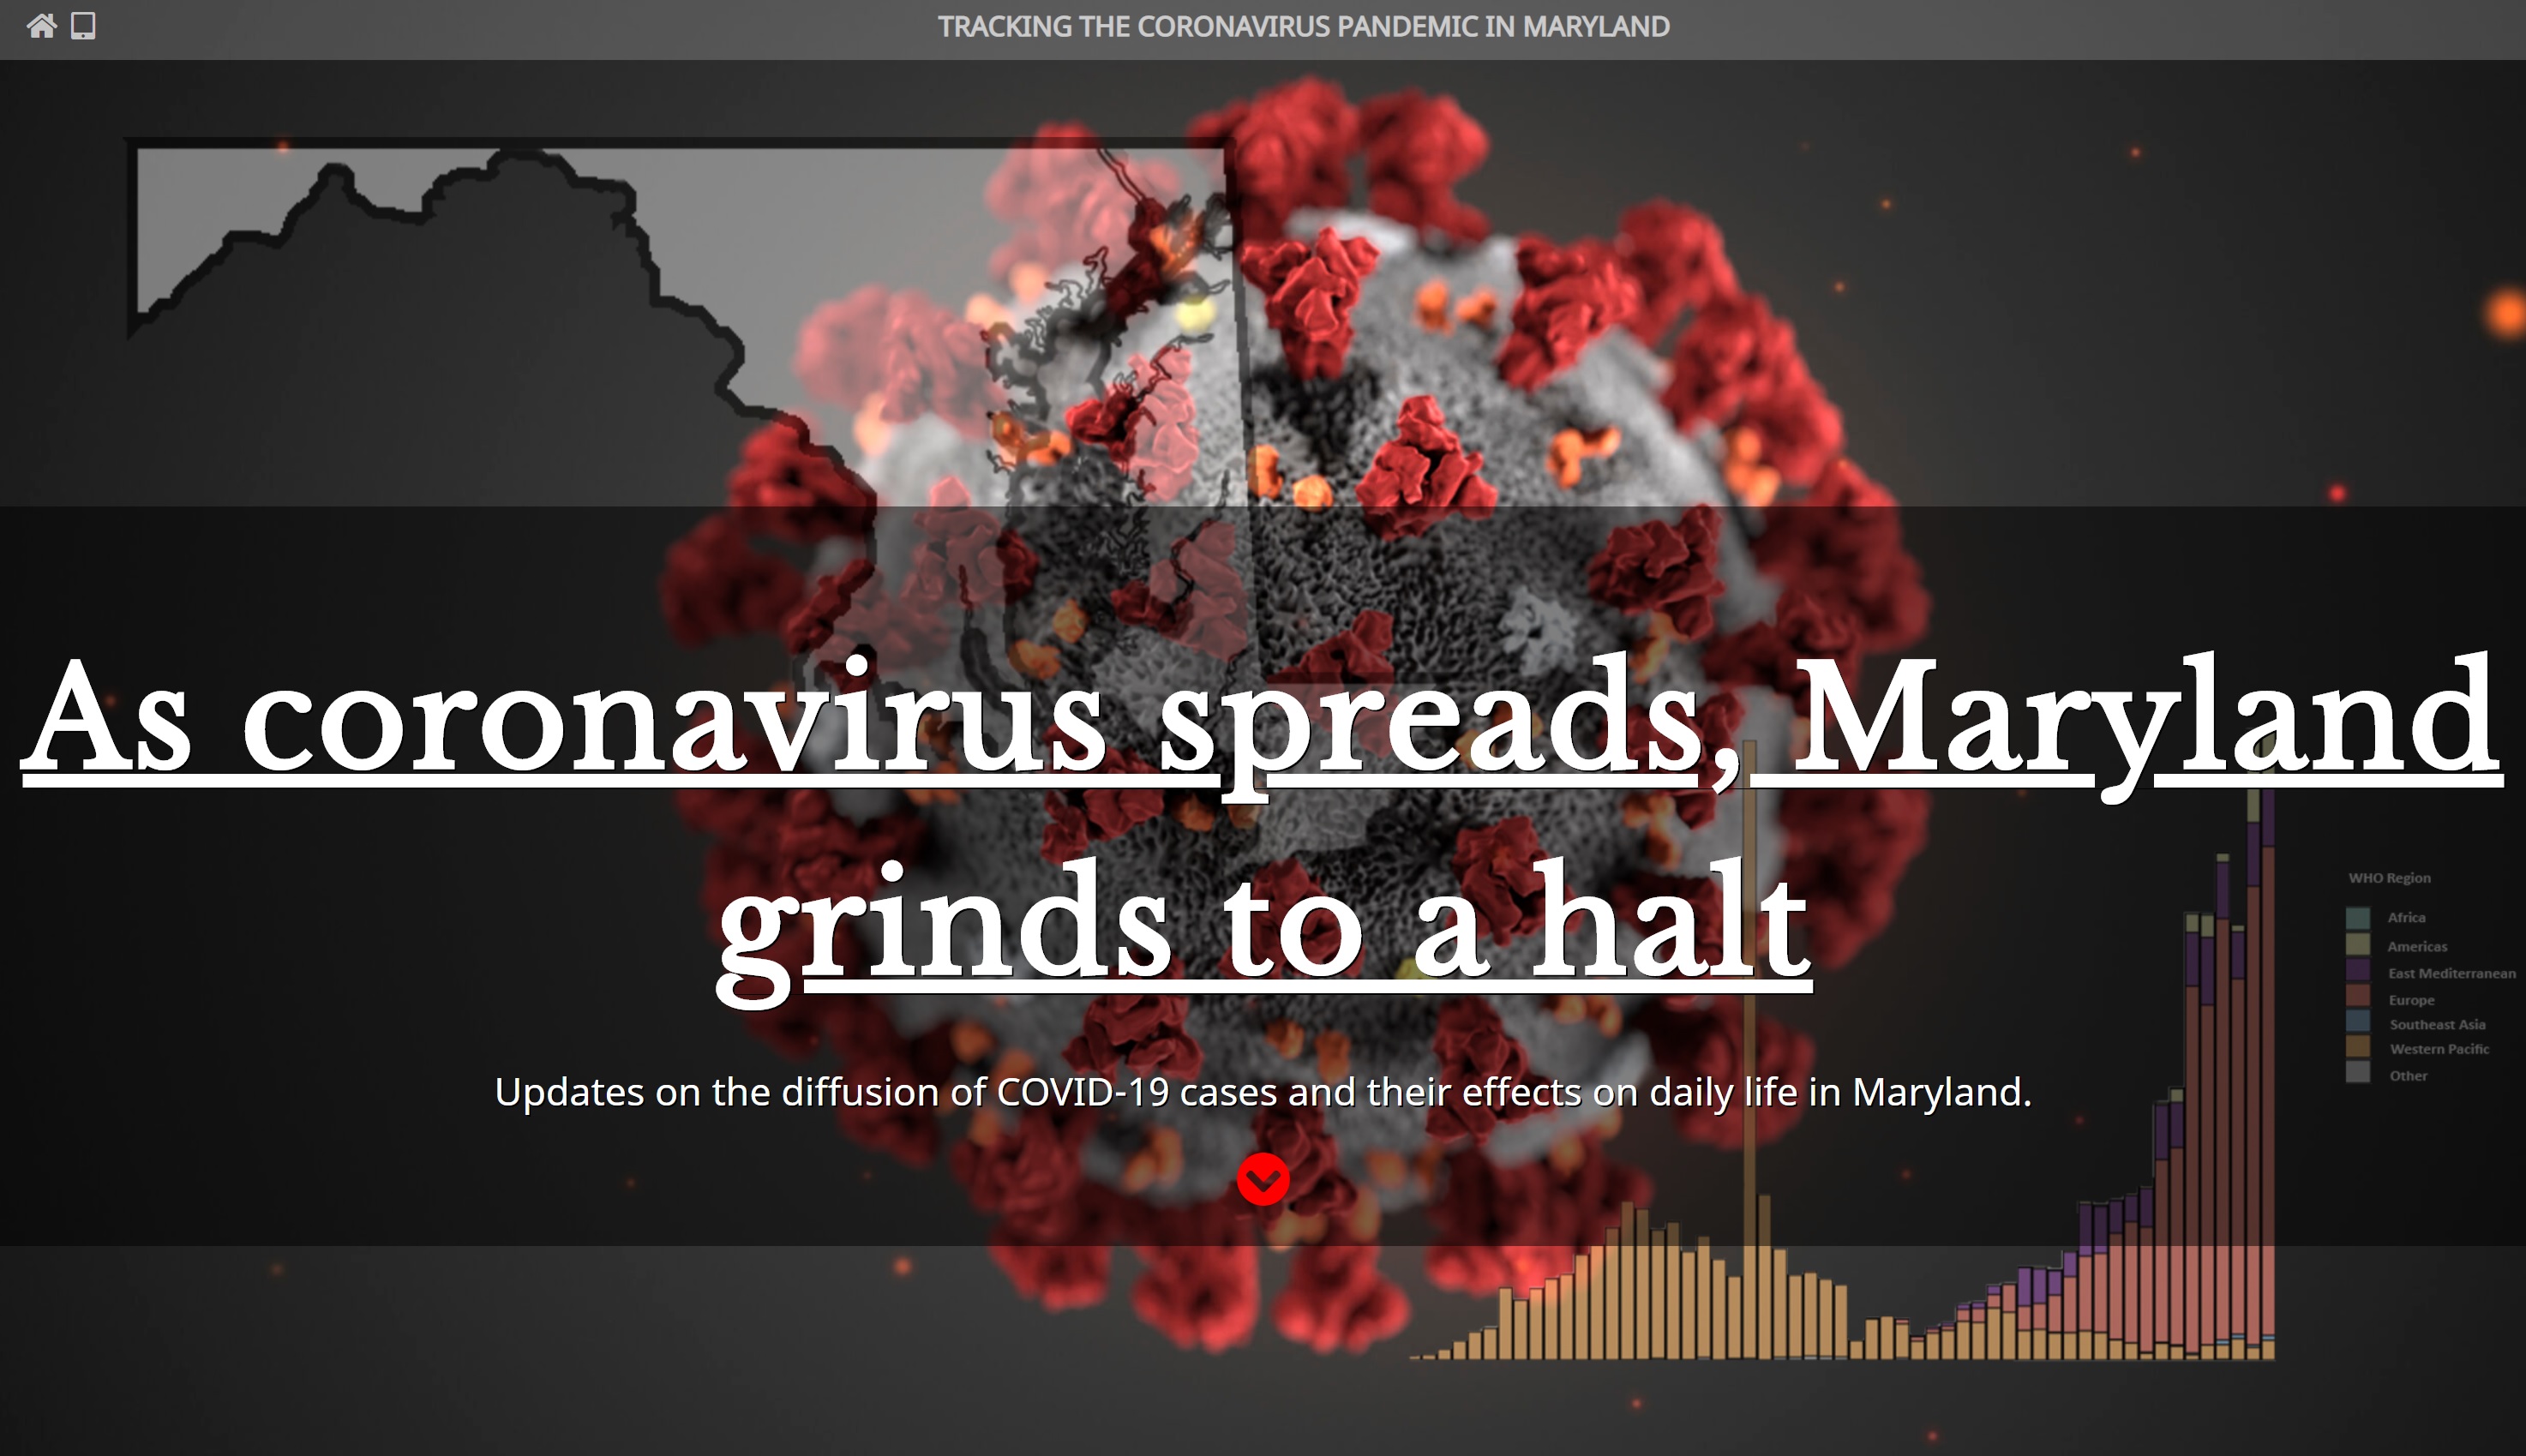
Screenshot of an interactive project intended to visualize state confirmed cases of the COVID-19 virus in Maryland.
Created a digital project to host data visualizations of confirmed COVID-19 cases in Maryland and provide daily updates on data and state responses to the outbreak. Hero image created with Photoshop. Page is responsive for desktop and mobile; built using html and css. Includes interactive links for social media sharing.

Screenshot of a blog designed to host student work for a feature writing class at the University of Maryland.
Designed a digital space to host a blog consisting of notes, assignments, and observations from students in the JOUR 371/689F: Feature Writing class at the University of Maryland. Blog was launched toward the end of the fall 2019 semester and will be updated to host student work from later semesters. Hero image modified slightly with Photoshop. Page is responsive for desktop and mobile; built using html and css.

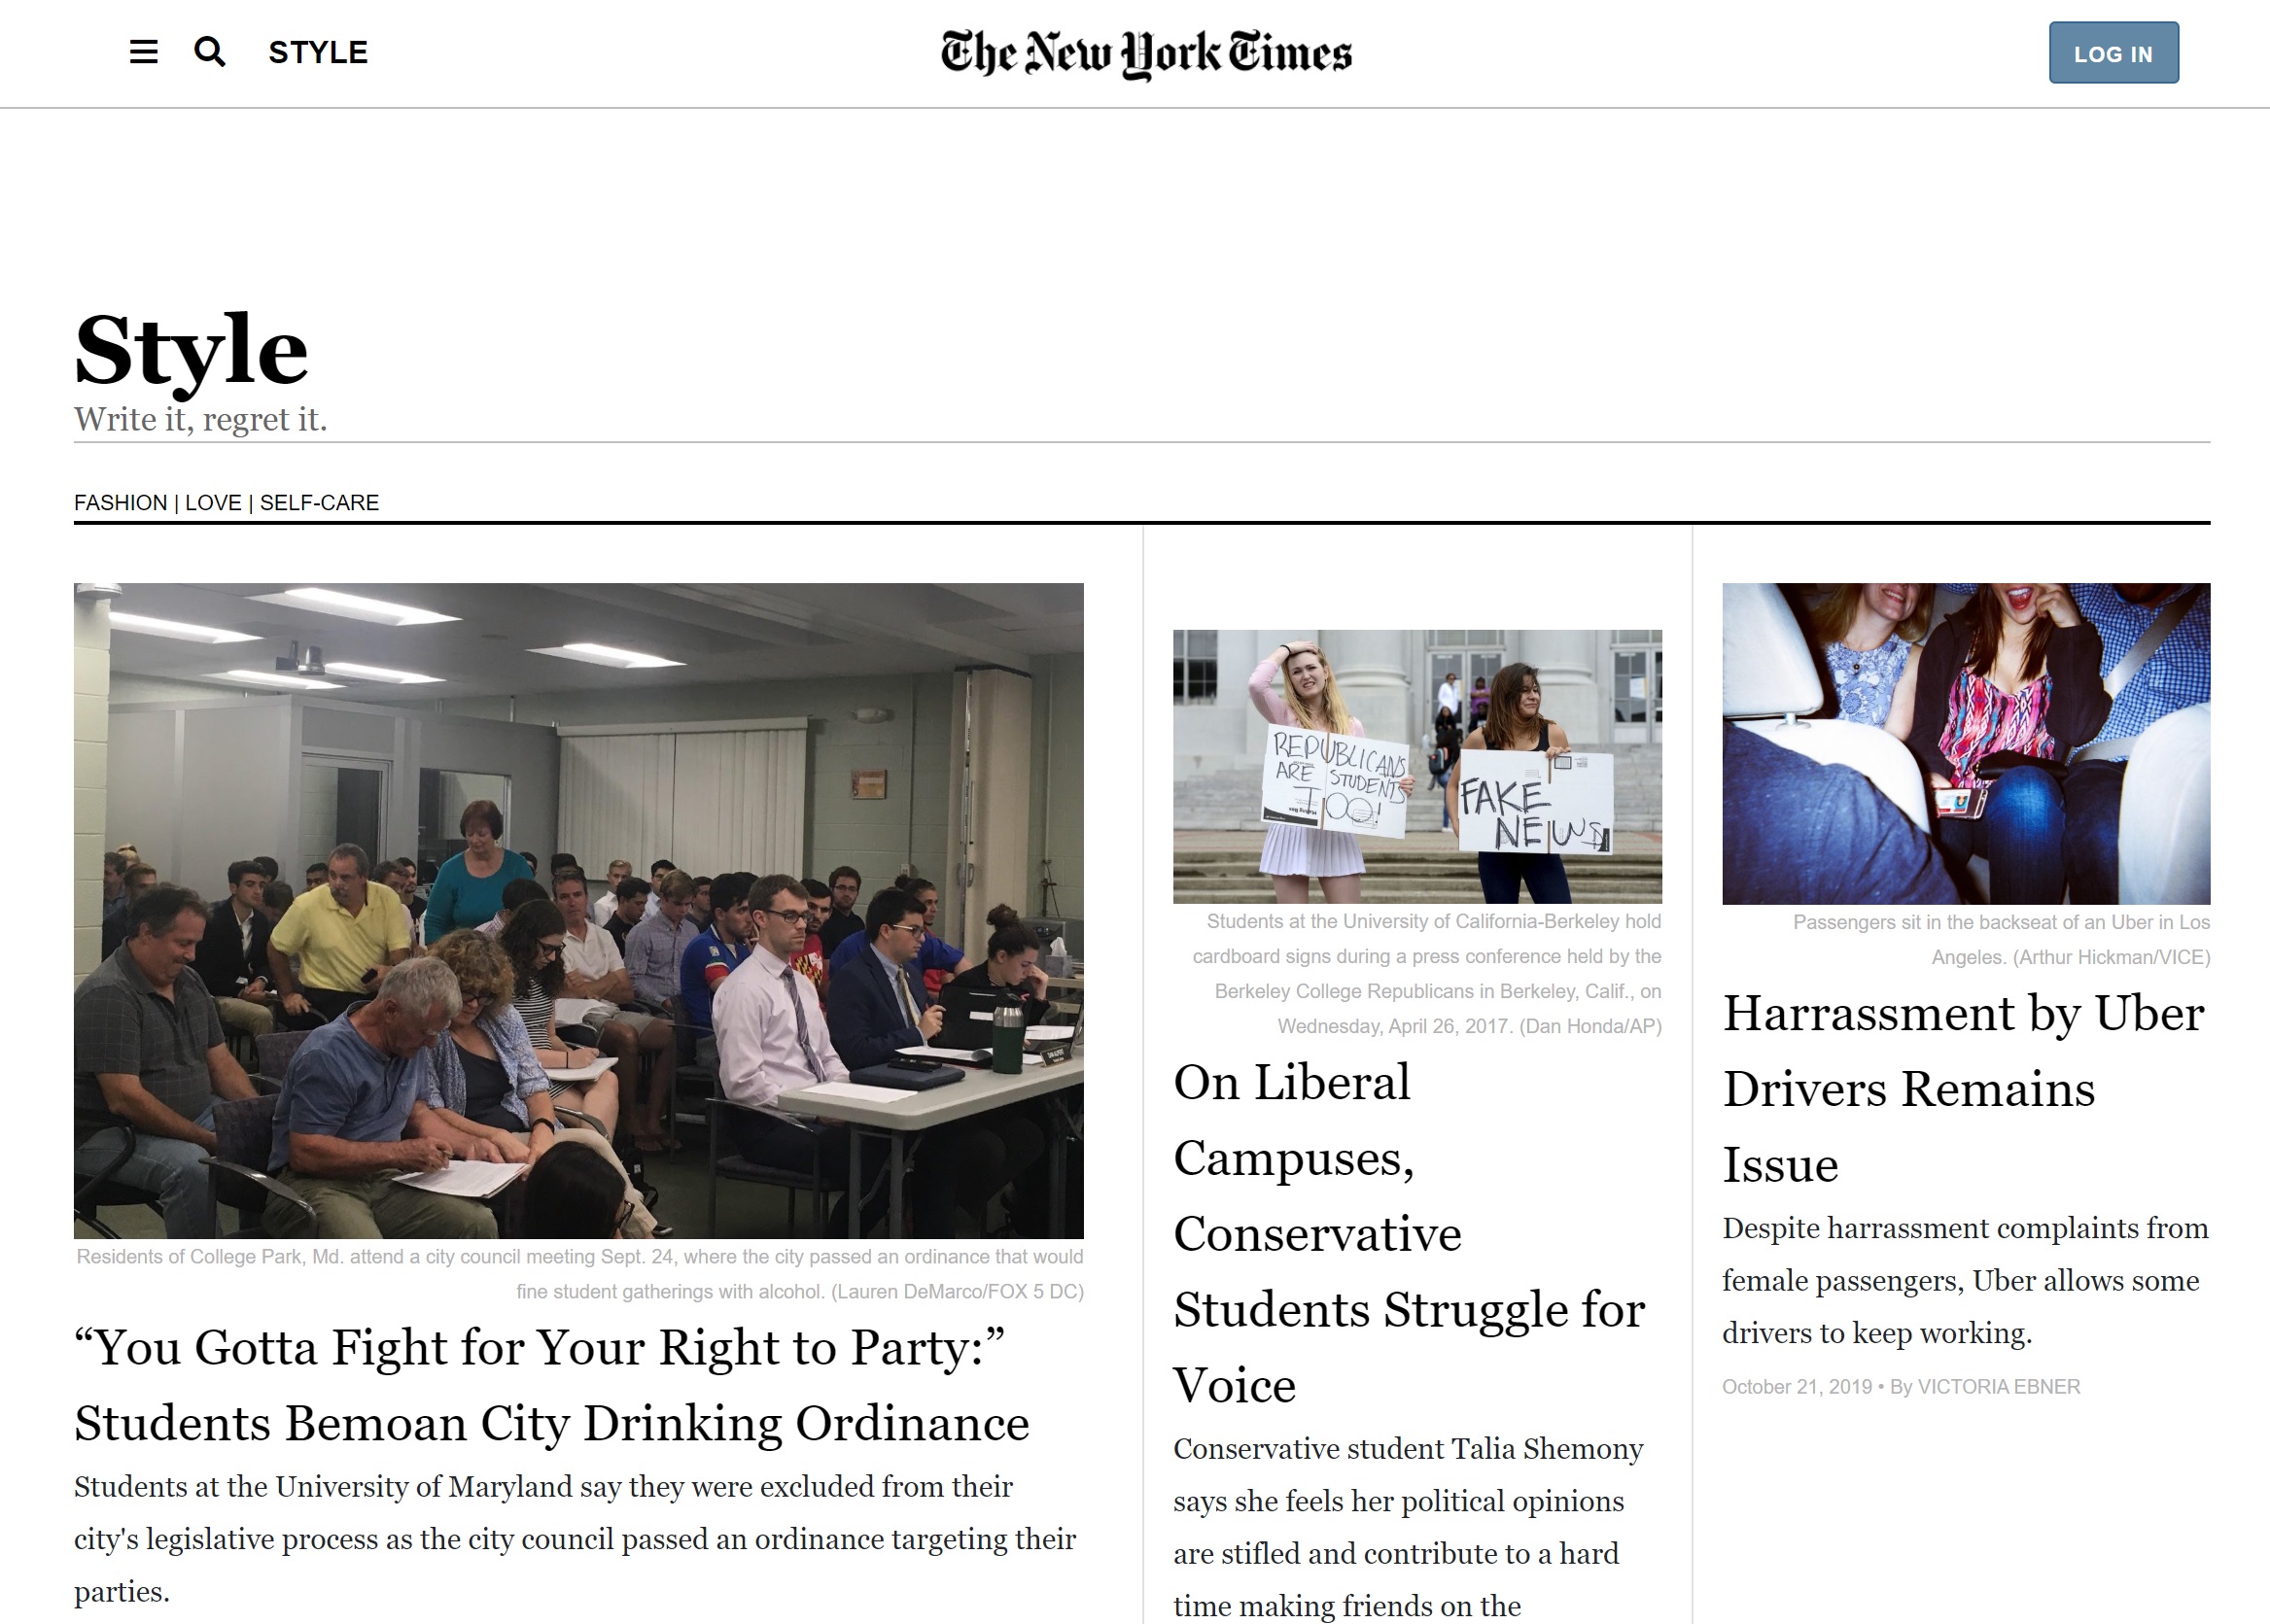
Screenshot of a responsive New York Times Style section built as a class project using html and css.
Created a digital layout of a Style section landing page intended to look like the New York Times. Coded and laid out five feature stories written and reported by myself and four colleagues in a group project for our JOUR 689F class. Web design includes individual pages for each story and is responsive for desktop and mobile.

Screenshot of a product demo landing page for "Smart Search," a job-finding app designed for a class project. Page is responsive; built using html and css.
Created a digital landing page for a journalism job-finding app, Smart Search. App designed by two colleagues and me for our JOUR 654: Advanced Interactive Multimedia Storytelling class at Maryland. Web page features animations and custom graphics and is responsive for mobile and desktop.

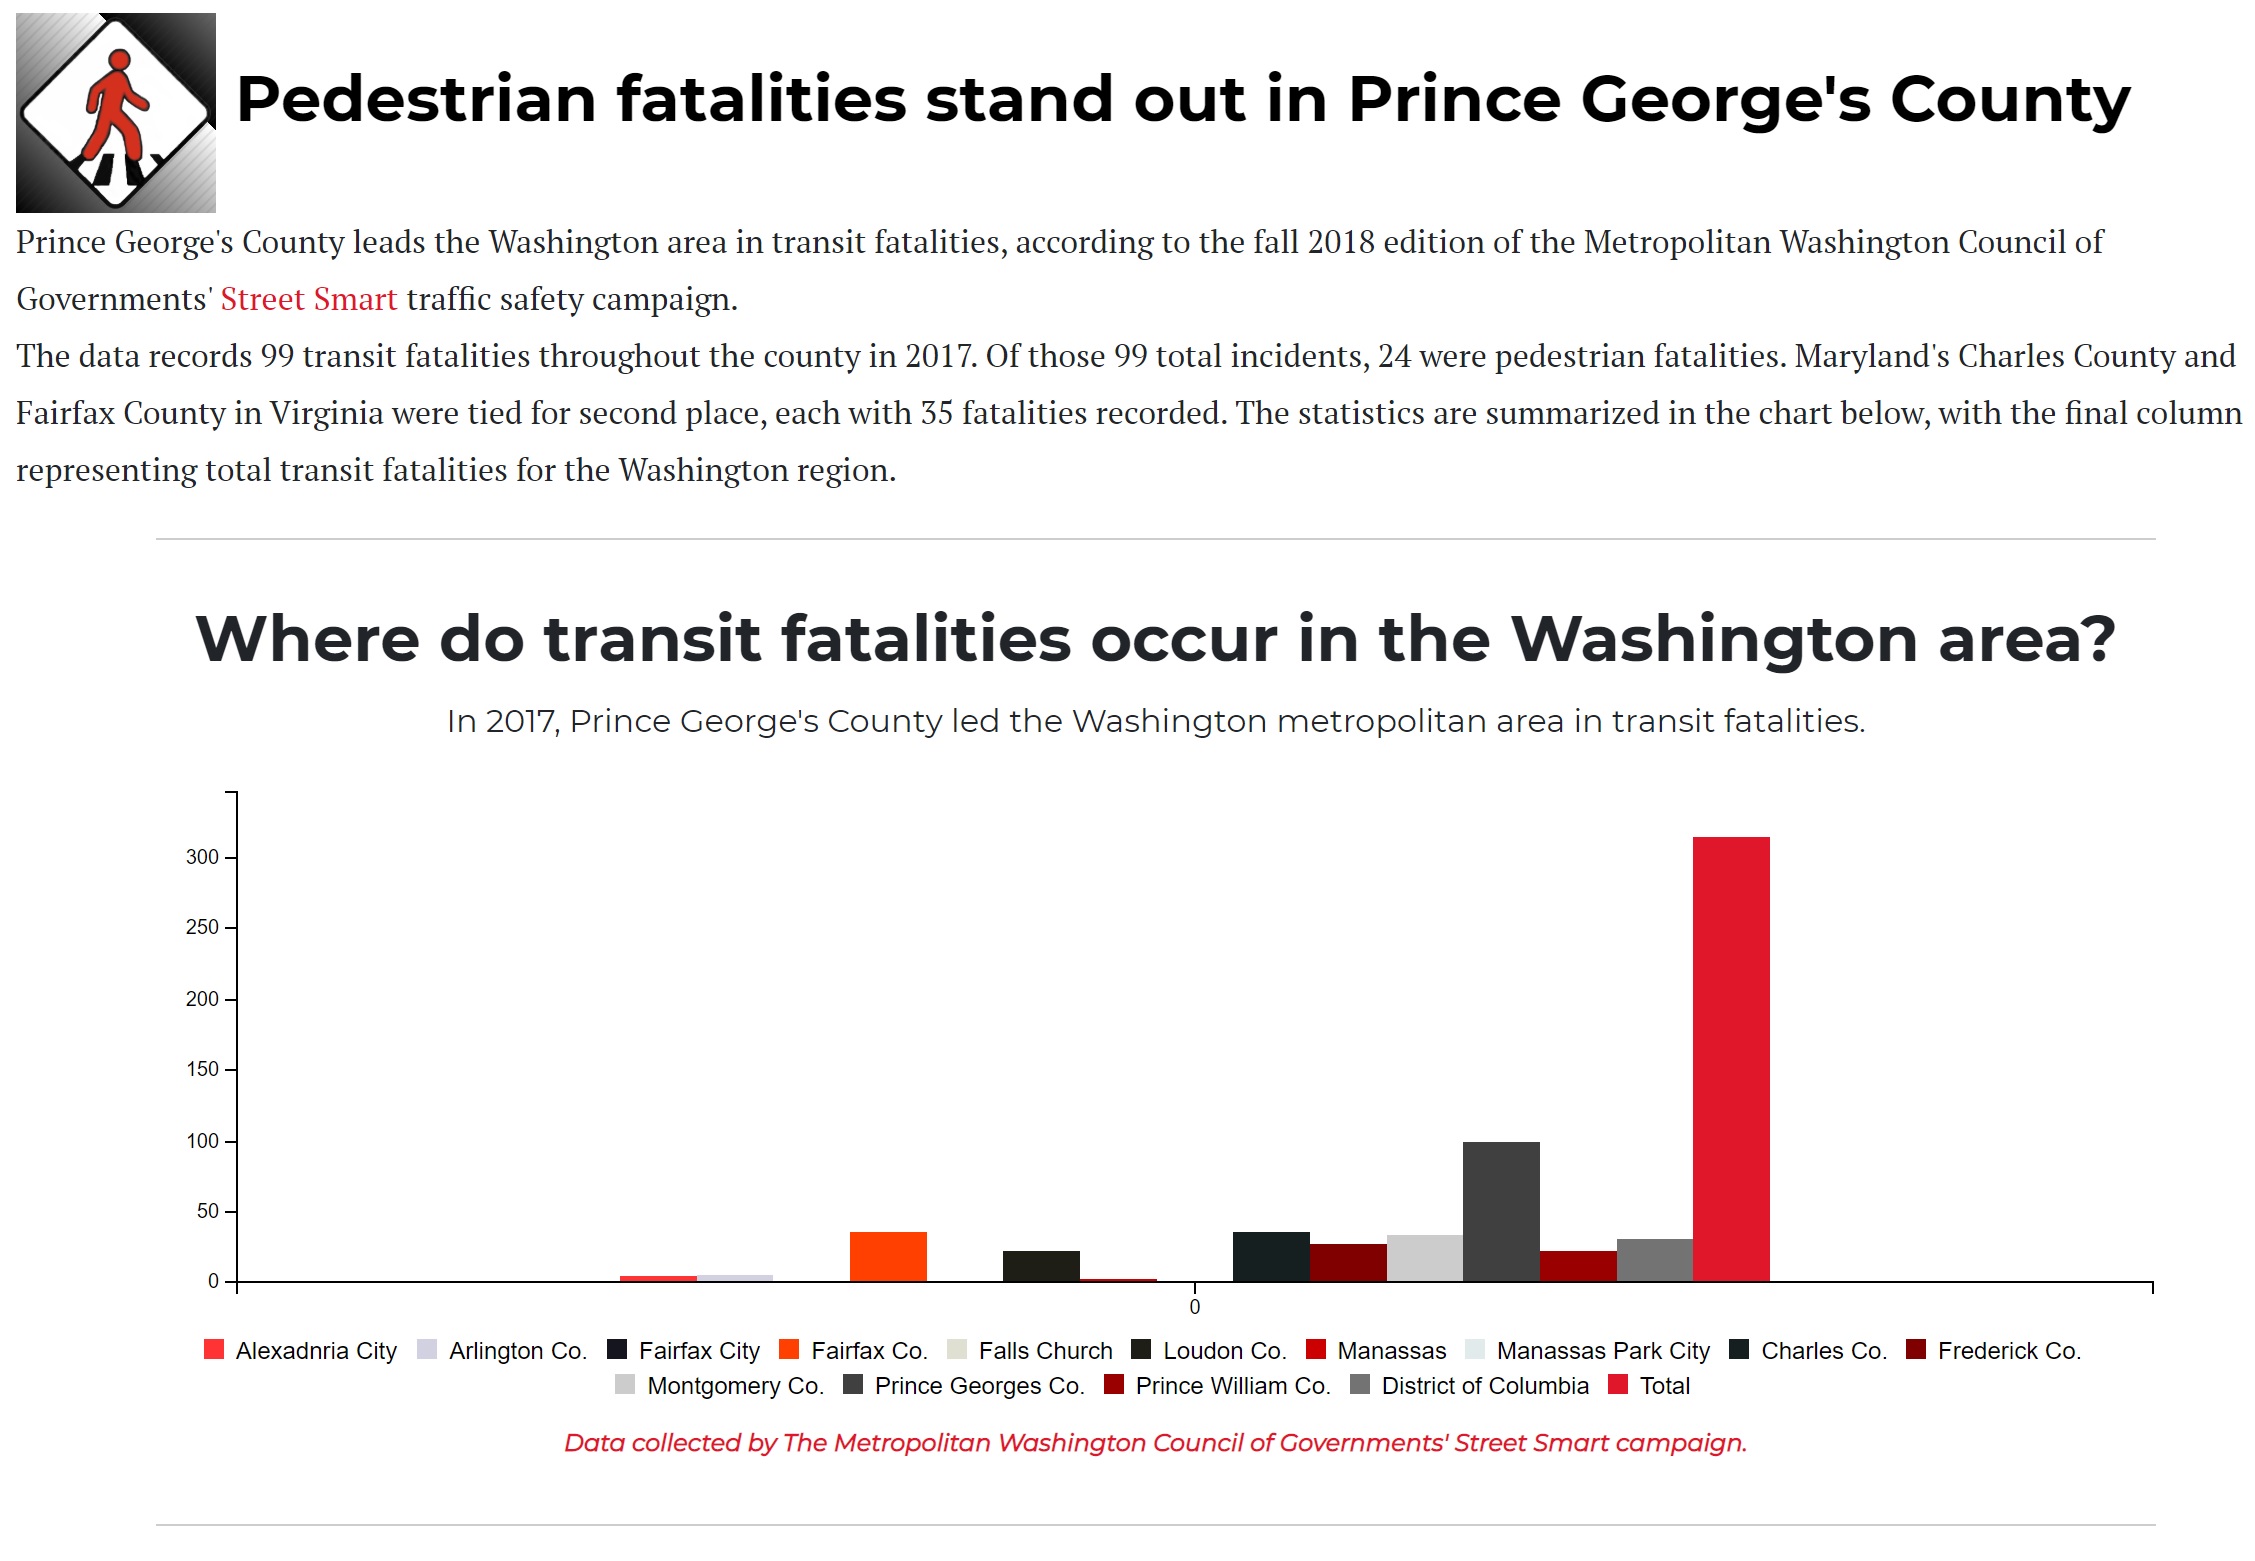
Screenshot of a story on pedestrian fatalities in College Park and Prince George's County, Maryland submitted as a final class project. Story built using html and css.
Reported, wrote and digitally designed a story on trends in pedestrian transit fatalities in College Park and Prince George's County, Maryland. Data-driven story includes several interactive graphics and visualizations to help engage the reader. Submitted as a final project in my JOUR 652: Interactive Design and Development class.

Screenshot of a story on school shootings in the United States. Story elements were laid out digitally using html and css.
Digitally produced an interactive story about data on mass shootings in American schools. Story utilized maps, interactive graphics and data visualizations to explore Washington Post findings on school shooting data. Submitted as a major project for my JOUR 652 class.